Every TCG investor has felt it, we definitely have. That specific discomfort of watching a card you almost bought climb 40% in a week while you hesitated, yeah… we all should have bought bubble mew. Or possibly even worse, watching a card you did buy fall 30% over two months and not knowing whether to hold or cut your losses, most TCG investors have been on both sides. Both of those feelings are symptoms of the same underlying problem, operating in a market without understanding the cycle that card is currently in.
Here at The TCG Times, we genuinely believe that understanding market cycles is the single highest-leverage knowledge upgrade available to a TCG investor. The ol knowledge is power. Sounds lame, but when it could make you thousands, it becomes a lot less lame. It does not tell you exactly which cards to buy. It tells you when to buy and sell any card, which is often worth more than any tip about a specific name. And can make you more money than just trying to guess the market like some Joe blow.
The Four Stages Every TCG Card Goes Through
TCG card prices do not move randomly, even when it looks that way in the moment. They follow a repeatable pattern that, once you can identify it, changes how you read every price chart you look at, and makes your investing tactics go from guessing to actual educated moves. The pattern has four stages, let’s break it down. Yes… there is pictures below to help you.
Stage 1: Accumulation. The card is underpriced, undesirable, or simply forgotten. Volume is low, meaning few people selling it. When this happens, the price is flat or very slowly drifting. At this stage it looks boring from the outside but represents the best possible entry point. The problem is that most new investors aren’t looking at cards in this stage because there is nothing exciting happening yet. The smart ones who eventually make the best returns were here, building their position quietly while everyone else was looking elsewhere. This is where you want to be.
Stage 2: Markup. Something creates change…. A tournament result, a content creator video goes viral, an anniversary announcement, a buyout, you get the idea. Volume spikes suddenly and of course price follows. This is the stage that generates the most excitement and the most social media activity (free marketing!) and it is the stage where the risk of buying in is highest (don’t get FOMO homie), because if you do buy, you are now paying the price that reflects the excitement rather than what the card’s actual worth.The late markup phase is almost always too late.
Stage 3: Distribution. Price is near or at its peak, if not hitting it. The collectors who accumulated early are selling into the enthusiasm of the new buyers arriving late (you wish you were this person). Volume remains high but the buying pressure is now being met by selling pressure from the early holders exiting. The price chart starts showing sharp moves in both directions rather than a steady climb. Experienced investors recognise this stage as the exit window, tiume to get the hell outta there! Most retail buyers are still interpreting it as “the price is high because the card is good”, which is kinda true and partly irrelevant to the investment decision.
Stage 4: Capitulation and Reset. The buying pressure exhausts itself. The last buyers have entered. Sellers who want to exit have now done so, leaving holders who either do not want to sell or cannot sell at the price they hoped for. So the price corrects, sometimes sharply (as little as days), and eventually settles at a new equilibrium. That equilibrium is typically higher than where the cycle began (the card has been re-rated by the market) but lower than the peak (the hype premium has faded).
What Each Stage Looks Like on a Price Chart
If you didn’t get any of that last part, don’t worry. Understanding the stages in theory is one thing. Recognising them in real time on a PriceCharting or TCGPlayer graph is what actually changes your decisions. Here is what to look for:
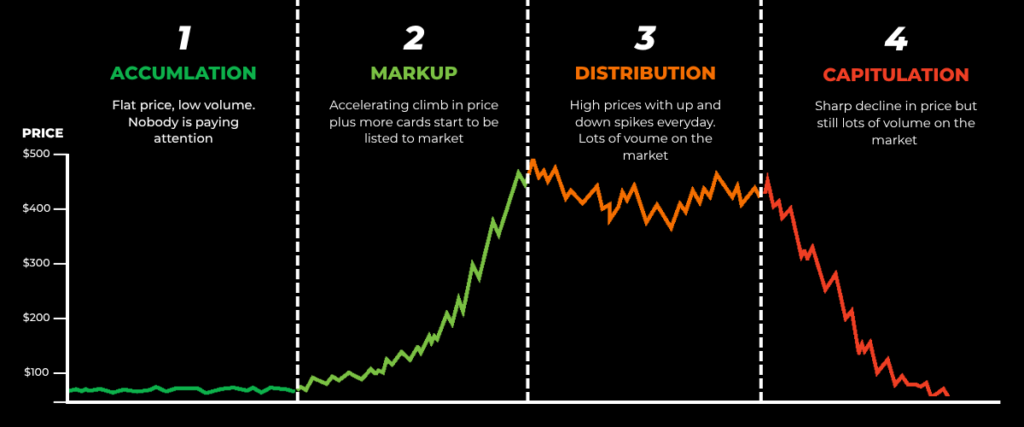
Accumulation looks like a flat or very slowly rising line with thin volume. The card has not moved meaningfully in weeks or months. Nothing interesting is happening. Most people are ignoring it.
Markup looks like a steep, accelerating climb, often near vertical over a short period. With a significant increase in volume/listing simultaneously. If volume spikes without a price move, it is usually distribution (sellers finding buyers). If both volume and price spike together, you are looking at markup in progress. Time to sell if you’ ‘re holding!
Distribution looks like high prices with erratic movement, up and down like a roller coaster, with a significant daily range. Price is not consistently moving in either direction. High volume but choppy price action.
Capitulation looks like a swift decline from the peak, often faster than the markup, with volume spiking on the way down as sellers exit and buyers who bought near the peak accept their losses. (More cards on the market from sellers who missed the hype). The bottom of the capitulation phase is the new starting point.
Why the Same Card Can Be in Different Stages in Different Markets
One weird thing worth understanding: the same physical card can be in different cycle stages across different platforms and markets simultaneously, this ones a little bit more of an advanced learning section. For example, a card might be in late markup on TCGPlayer (prices rising fast, US buyer pool active) while still in accumulation on Japanese secondary markets (where awareness has not yet spread). This is why investors who monitor multiple markets can sometimes identify opportunities that single-market observers miss entirely, therefore giving them the edge on what could happen in another market.
The Japanese/English dynamic in One Piece TCG is the clearest current example at the moment. Japanese market pricing on chase cards typically leads English pricing by weeks or months, meaning a card in markup in Japan is often still in accumulation in the English market (refer back to the graph above if needed) a window that the simultaneous release schedule Bandai moved to in 2026 has now largely closed, but which was a genuine and exploitable arbitrage for early movers and still a solid case study.
The Psychological Trap at Each Stage
Every stage has a specific psychological trap that consistently catches investors who have not internalised the cycle framework. Experienced investors know this as they have fallen for these traps, some more than once…..
The accumulation trap is boredom, doubt and cash burning a hole in ya pocket. When nothing is happening with a card and the narrative around it is negative, it is psychologically very hard to deploy capital into it. The conditions that make accumulation the best entry point are the same conditions that make it feel like the worst time to buy (because it could be).
The markup trap is FOMO, if it has got you before, chances are it’ll get you soon. The subject of an entire piece we have written here at The TCG Times, because it is the most powerful and most costly psychological force in the market. We covered the full scope of it in our FOMO and market psychology piece. The markup stage feels fear plus a sense of urgency. It is actually the stage of highest risk relative to expected return.
The distribution trap is denial. Investors who bought during markup are now holding a card at peak prices while watching that peak price fall. The natural response is to interpret every up day as evidence of continued strength and ignore the warning signs. Selling during distribution is the right call and feels premature every time.
The capitulation trap is panic selling at the bottom. The card has corrected sharply and everyone is calling it a bad investment. This is the moment when investors who should be accumulating for the next cycle are instead selling their position at the worst possible point.
The Simple Rule That Comes Out of All of This
Buy during accumulation. Sell during distribution. Every version of successful TCG investing comes back to this principle in some form. The challenge is not knowing the rule, it is having the psychological discipline to act on it when the market is telling you the opposite feels right. Seems kind of boring and safe but when the money is in your account, that boring investor’s feeling turns into happiness.
As we covered in our sunk cost trap piece, the most expensive mistakes in this hobby almost always involve the distribution and capitulation stages, either selling too late or holding through a correction you knew deep down was coming. The market cycle framework does not eliminate those mistakes entirely, but it gives you the language and the visual framework to see them coming from further away.
Disclaimer: The TCG Times is a news and educational platform. All content provided is for informational purposes only and should not be construed as professional financial advice. Trading cards are high-risk, volatile assets. Past performance is not indicative of future results. Always perform your own due diligence before making financial decisions.