
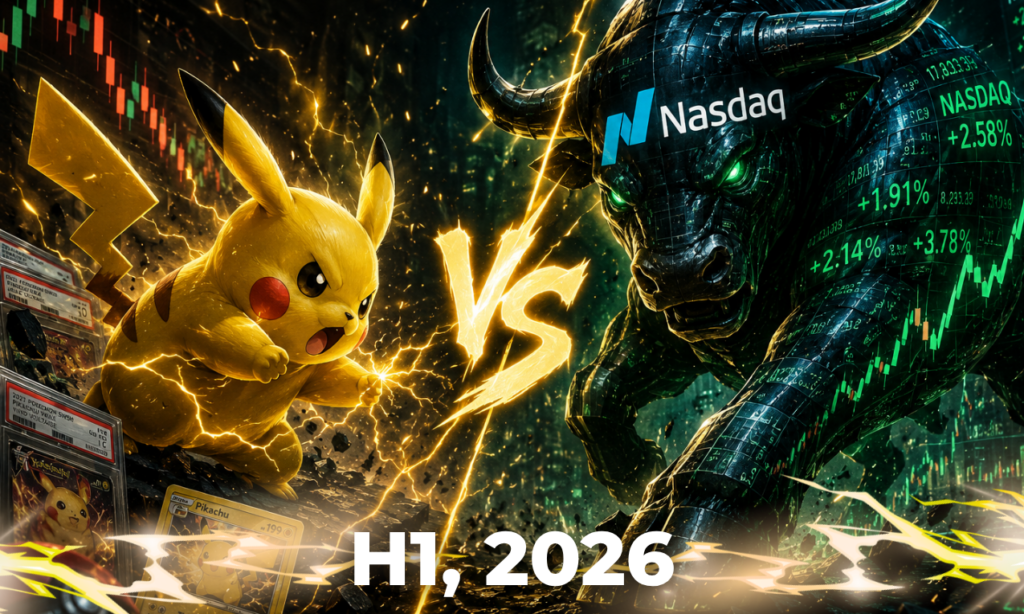
Every six months here at The TCG Times, we are going to do something that most card publications do not bother with: put our hobby’s investment performance directly next to the traditional financial benchmark that most of our readers money is sitting in when it is not buying cardboard, as we have said before, we are about the money side of this hobby (not scalping, chill out homie)! No sugarcoating, no selective framing, just an honest head-to-head that gives you real context for where your TCG portfolio sits relative to the alternative.
The benchmark we are using is the NASDAQ 100, the index that tracks the 100 largest non-financial companies on the NASDAQ exchange, and the most relevant comparison for a growth-asset class like Pokémon cards. First half of 2026, January through June. Let us run the numbers.
The NASDAQ 100: A Strong First Half
The NASDAQ 100 returned +17.92% in the first half of 2026, as of June 29. That is a genuinely a pretty strong result by historical standards, comfortably above the index’s long-run average annual return and it sets a higher bar for any alternative asset class trying to outperform.
To keep you up to speed and be clear about what that number means in practice: a $10,000 investment in the NASDAQ 100 at the start of January 2026 was worth approximately $11,792 at the end of June ($1,792 increae, honestly pretty decent). Liquid, diversified, no storage costs, no authentication required, no grading fees. That is the competition. That’s what the cardboard boys are up against.
The Pokémon TCG: A Watershed Half-Year
The first half of 2026 was not a normal period for the Pokémon TCG market. The 30th anniversary celebrations, which kicked off formally on Pokémon Day on January 30, created a wave of buying pressure across the board and all at the same time, making H1 2026 (the first half of the year for the new peeps) one of the most active periods the secondary market has seen since the pandemic boom of 2020-2021. This context matters when reading the numbers, they are strong in part because of an extraordinary, once-every-five-years catalyst.
The headline figure: the Card Ladder Pokémon Index increased by approximately 116% over the past year, with January 2026 marking what market trackers described as a “watershed moment” (this is just a fancy way of saying a big moment happened) for the market. The TCGFish Sealed Index, which tracks the value of Pokémon sealed product, posted +13.52% in the 90-day window to February 8, 2026 alone, before the anniversary momentum had even fully developed. The TCGFish Graded Index (PSA 10 cards specifically) was up +12.84% in that same 90-day window.
To put those numbers in plain terms: Pokémon cards have been one of the best-performing collectible assets of the past two decades. A basket of the top 500 Pokémon cards has delivered returns 94% higher than the S&P 500 (top 500 companies) over ten years, and since 2004, the broader Pokémon card market has grown by over 3,800%, compared to around 483% for the S&P 500 over the same period (that’s massive!). In other words, for every dollar the stock market returned, a well-positioned Pokémon collection returned roughly eight.
Within H1 2026 specifically, the cards and products that performed best were older sealed tins from the Celebrations set (these tins have become very popular) up between 39% and 65%, anniversary-linked modern products that rode the 30th birthday wave, and high-grade vintage cards with a PSA 10 rating, which broadly gained 30-50% across the anniversary period. In short: old stuff in great condition, and anything with a connection to the 30th anniversary celebrations.
The Honest Caveats
We are committed to making this comparison genuinely useful, which means being upfront about the limitations of putting these two asset classes side by side. Big numbers are great, but we need to be clear.
Liquidity. A NASDAQ 100 index fund can be sold in seconds during market hours. A PSA 10 Charizard can be sold in days to weeks, and the spread between the list price and actual transaction price can be meaningful. The NASDAQ number is what you get. The Pokémon number is what someone listed.
Cost basis. The NASDAQ 100 return does not include brokerage fees, but those are negligible for most investors. The Pokémon number does not include grading fees (which can be $25-$100+ per card), storage costs, shipping, marketplace fees (eBay takes approximately 12-15%), or the time investment of managing a collection. The real net return on Pokémon is lower than the gross market price movement suggests.
Segment variance. A broad NASDAQ return applies uniformly to every dollar invested in the index. In Pokémon, the range of outcomes between the best-performing segment (PSA 10 vintage, anniversary-adjacent product) and the worst (modern sealed product caught in overprinting cycles) is enormous. The headline index numbers describe the market’s strongest performers, not average returns across all holdings.
The Verdict: H1 2026
On the headline numbers, a well-positioned Pokémon portfolio significantly outperformed the NASDAQ 100 in H1 2026 (this doesn’t mean all cards are bound to be an awesome investment). A collection concentrated in vintage graded cards, sealed Celebrations-era product, and anniversary-adjacent card and sealed delivered returns that made the NASDAQ 100’s impressive 17.92% look modest by comparison. And seriously, that 17.92% on the NASDAQ is really solid.
For the average collector with a broad, mixed-era collection, the picture is more nuanced, some segments outperformed meaningfully, others tracked more closely with or below the NASDAQ, particularly in overprinted modern product.
The anniversary effect that supercharged H1 2026 will not be present in the second half of the year to the same degree, but do not expect H2 to be quiet either. The 30th Celebration set drops on September 16, 2026, and as we covered in our piece on why September is the best time to sell Pokémon cards, anniversary set releases have a well-documented track record of pushing older card and sealed product prices to new highs around launch. The buying pressure that builds in the weeks before and after September 16 could make H2 2026 every bit as strong as the first half, arguably stronger if the set performs to the level the 30th anniversary warrants. We will revisit this comparison in January 2027 with the full-year numbers. Interested in seeing what your collection might look like by 2030? Run it through our Pokémon Collection Value Estimator and see for yourself.
Disclaimer: The TCG Times is a news and educational platform. All content provided is for informational purposes only and should not be construed as professional financial advice. Trading cards are high-risk, volatile assets. Past performance is not indicative of future results. All comparisons are for educational purposes only. Always perform your own due diligence before making any financial decisions. The NASDAQ 100 return figure is sourced from Slickcharts as of June 29, 2026.

Pingback: TCG Cards vs LEGO: Which One Actually Makes More Money? - TheTCGTimes.com